Fermentation Loss: 3 Metrics Every Brewery Should Track and Review to Improve Batch Yields
A brewery can operate an efficient brewhouse, consistently hit its target knockout volume, and still lose a meaningful amount of finished beer before packaging ever begins. Between knockout and transfer to the brite tank, beer volume is naturally reduced through yeast growth, trub sedimentation, dry hop absorption, vessel dumps, filtration, clarification, and transfer losses. Some of this loss is unavoidable. The challenge is determining how much loss is reasonable, how consistently it occurs, and whether preventable process issues are quietly reducing finished yield.
Many breweries track brewhouse efficiency and packaging loss but do not isolate fermentation loss with the same level of detail or regular review. Instead, they compare the volume brewed with the final volume packaged and treat everything in between as general production loss. That makes it difficult to determine where volume was actually lost or what operational/process changes may improve recovery.
A brewery may appear to have a packaging yield issue when the loss actually occurred several weeks earlier during fermentation, yeast removal, dry hopping, clarification, or transfer. Without measuring each production stage independently, these losses can remain hidden within the broader production process and difficult to eliminate. The goal is not to eliminate fermentation loss entirely. That would be unrealistic. The goal is to understand normal loss, establish reasonable performance expectations for each style and brand, identify unnecessary variation, and improve finished beer recovery over time.
The following three metrics provide a practical starting framework from the Plato Improvement Process methodology for doing exactly that.
Metric #1: Fermentation Loss Percentage by Batch
The most important place to begin is calculating fermentation loss for every batch. Fermentation loss percentage measures the amount of beer lost between knockout into the fermenter and transfer out of the fermenter. The calculation is:
Fermentation Loss % =
(Volume Knocked Out Into the Fermenter – Volume Transferred Out of the Fermenter) ÷ Volume Knocked Out Into the Fermenter
For example, assume a brewery knocks out 60 barrels of lager into a fermenter and later transfers 56.5 barrels into a brite tank.
The calculation would be:
(60 BBL – 56.5 BBL) ÷ 60 BBL = 5.8% Fermentation Loss
The corresponding fermentation yield would be:
56.5 BBL ÷ 60 BBL = 94.2% Fermentation Yield
For a non-dry-hopped lager that has been given sufficient time to ferment, lager, chill, and clarify, this may represent strong and reasonable performance. Now consider a second batch of the same beer..
The brewery again knocks out 60 barrels but transfers only 51.3 barrels into the brite tank.
The calculation becomes:
(60 BBL – 51.3 BBL) ÷ 60 BBL = 14.5% Fermentation Loss
That represents an additional 5.2 barrels of lost volume compared with the previous batch. One result may not immediately indicate a problem. There may have been an unusual process condition, measurement error, equipment issue, or quality-related decision that affected the final transfer. However, when these results are tracked consistently, patterns begin to emerge.
The brewery may find that:
One brand or style consistently produces greater losses than expected.
Dry-hopped beers have increasingly variable recovery.
Certain tanks produce lower yields than comparable vessels.
Loss increases when fermentation schedules are shortened.
Specific operators consistently record higher or lower transfer volumes.
Yeast and trub dumping practices vary substantially between shifts.
Each one of these findings would infer a different approach to correct. Without a batch-level calculation, these differences remain difficult to identify.
Fermentation loss percentage creates a baseline measurement that allows the brewery to compare similar batches, evaluate process performance, and determine whether operational changes are improving finished beer recovery.
What Is a Reasonable Fermentation Loss?
There is no universal target that applies equally to every brewery or beer style. Generally speaking, the lower the loss, the better (obviously). Overall, if your losses begin to creep over 20% for any brand or style, it is worth looking into what is causing it and how to improve.
Fermentation loss depends on several variables, including:
Yeast strain
Fermentation behavior
Dry hop volume
Hop product format
Yeast harvesting practices
Number and size of vessel dumps
Clarification method
Filtration or centrifugation
Transfer equipment
Process timing
Finished beer specifications
A lightly hopped lager should not necessarily have the same loss expectation as a heavily dry-hopped double IPA.
The objective is not to force every product toward a single brewery-wide percentage. The objective is to establish a reasonable target specification for each product or or style and improve consistency around that expectation.
Metric #2: Variance From the Expected Loss Target
Knowing that a batch experienced 12% fermentation loss is useful. Knowing that the same brand normally experiences 7% loss is much more useful.
The second metric every brewery should monitor is the variance between actual fermentation loss and the expected loss target for that product. The calculation is:
Fermentation Loss Variance = Actual Loss % – Target Loss %
Assume a brewery establishes an expected fermentation loss target of 7% for its flagship pale ale. One batch records a fermentation loss of 8%. The variance is:
8% Actual Loss – 7% Target Loss = 1 Percentage Point Above Target
This result may fall within an acceptable operating range. A later batch records a fermentation loss of 13%. The variance becomes:
13% Actual Loss – 7% Target Loss = 6 Percentage Points Above Target
That level of variance should prompt additional review. The purpose of a target is not to penalize the production team for every deviation. Brewing is a biological and operational process, and some variation is inevitable. The target provides a reference point that helps distinguish normal process movement from meaningful performance changes.
For each major brand or style, breweries should consider establishing:
A target fermentation loss percentage
An acceptable operating range
A threshold that triggers further review
For example:
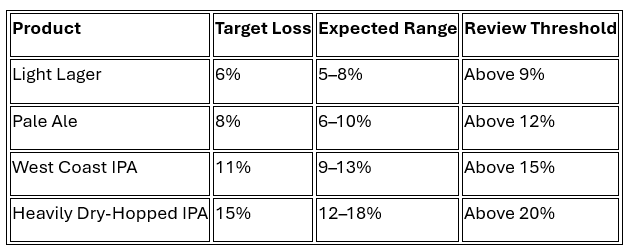
These examples are illustrative rather than universal operating standards. Each brewery should develop targets based on its own equipment, products, ingredients, processes, and historical performance. The greatest value often comes from comparing the brewery against its own demonstrated capabilities.
If your brewery has repeatedly transferred a specific lager at a 94% yield, a sudden reduction to an 85% yield deserves review even if another brewery considers that result normal.
Investigating Variance
Once an abnormal result is identified, the brewery can review the operational factors that may have contributed to it. Useful production information may include:
Dry hop quantity
Dry hop duration
Yeast harvest volume
Number of yeast or trub dumps
Dump volumes
Cold-conditioning duration
Transfer date
Tank identification
Operator(s) throughout process
Filtration or clarification method
Transfer pressure
This information does not need to create a complicated reporting burden. These fields should be included on your fermentation and transfer logs. The purpose is to identify the small number of variables most likely to explain unusual performance.
Consider a brewery producing the same lager in the same fermenter size. Most batches experience between 5% and 7% fermentation loss. Several newer batches begin recording losses between 12% and 15%. A review determines that a newer cellar employee has been performing larger and more frequent yeast dumps before transfer. The employee believed more aggressive dumping would improve clarity but was unintentionally removing a meaningful amount of finished beer along with the yeast.
The solution may be relatively simple:
Standardize the dump procedure.
Establish expected dump frequency.
Create a visual or TDS process guideline.
Train cellar employees on the updated procedure.
Review the following batches to confirm improvement.
The issue was not a major equipment failure or recipe problem. It was a small, repeatable process variation that became financially meaningful because it occurred across multiple batches. This is exactly the type of opportunity that becomes visible when loss is measured against an established target.
Metric #3: Lost Volume and Financial Impact
Percentages are valuable for production analysis, but percentages alone do not always communicate the true business impact of yield loss. The third metric is the amount of volume lost and its estimated financial value.
Lost volume can be calculated as:
Lost BBL = Knockout Volume – Transfer Volume
Using the earlier example:
60 BBL Knockout – 51.3 BBL Transferred = 8.7 BBL Lost
However, not all 8.7 barrels represent preventable loss.
Assume the established target for the product is 7%.
Expected loss would be:
60 BBL × 7% = 4.2 BBL Expected Loss
Actual loss was:
8.7 BBL
The volume lost above the expected target would therefore be:
8.7 BBL Actual Loss – 4.2 BBL Expected Loss = 4.5 BBL Above Target
Those 4.5 barrels represent potential improvement opportunity.
The financial impact can be estimated in several ways. At a minimum, the brewery can calculate the production cost per barrel associated with the lost beer. A more complete analysis can estimate the contribution margin or potential revenue that could have been generated if the additional volume had reached packaging and been sold.
For example, assume:
Avoidable loss: 4.5 BBL
Packaged equivalent: approximately 62 case equivalents per barrel
Average contribution margin: $45 per case equivalent
The estimated contribution opportunity would be:
4.5 BBL × 62 Case Equivalents × $45 = $12,555
This does not mean the brewery automatically lost $12,555 in cash. The product would still need to be packaged, distributed, and sold. However, the calculation illustrates the economic value of beer that was already brewed but never became available for sale. The raw materials were purchased, the brewhouse labor was completed, utilities were consumed, tank capacity was occupied, and fermentation time was invested. The brewery still absorbs the same production costs but did not receive the corresponding finished volume. When unnecessary fermentation loss repeats across dozens or hundreds of batches, the annual impact can become substantial.
Measuring Annual Opportunity
Assume a brewery produces 100 similar batches annually. Each batch averages 2 barrels of avoidable fermentation loss above the established target.
Annual avoidable loss would be:
100 Batches × 2 BBL = 200 BBL
Even modest improvement may produce meaningful results. Reducing avoidable loss by only 25% would recover:
200 BBL × 25% = 50 Additional BBL Annually
That improvement does not require additional brewhouse capacity. It does not require additional fermentation tanks. It does not require brewing more batches. It improves the amount of sellable beer recovered from production activity the brewery is already performing. This is why yield improvement can be one of the most capital-efficient operational opportunities available to a brewery.
Common Causes of Excessive Fermentation Loss:
Most fermentation loss problems are not caused by one dramatic event. They are usually the accumulated result of smaller process factors. Common contributors include:
Excessive Yeast or Trub Dumping
Removing yeast and sediment is a necessary cellar activity, but inconsistent dumping practices can remove significant beer volume. Differences in dump duration, frequency, pressure, endpoint, and operator technique can create substantial batch-to-batch variation. Standard procedures should define when dumps occur, what the operator is observing, and how the endpoint is determined.
Dry Hop Absorption
Dry hopping naturally increases beer loss because hop material absorbs liquid and contributes additional solids. Higher dry hop rates generally increase expected loss, but actual recovery may also depend on hop format, contact time, tank geometry, temperature, agitation, and transfer method. Dry-hopped (and fruited) products should be evaluated separately from non-dry-hopped products.
Insufficient Clarification Time
Production pressure may encourage teams to shorten conditioning schedules or transfer beer before solids have sufficiently settled. Accelerating the schedule may reduce tank time but increase transfer loss, filtration load, or downstream packaging challenges. The operational benefit of faster tank turnover should be evaluated against its effect on yield and finished quality.
Inconsistent Transfer Practices
Transfer pressure, flow rate, racking position, tank orientation, and operator decisions can influence recovery. One operator may stop a transfer at the first sign of haze, while another continues until product quality reaches a defined threshold. Without a standardized endpoint, finished volume may depend heavily on who performs the transfer.
Measurement Error
Not every reported yield issue represents actual product loss. Inaccurate flowmeter readings, tank calibration problems, inconsistent volume estimates, and data-entry errors can distort reported results. Before changing production procedures, verify that the underlying measurements are reasonably accurate and consistently recorded.
Tank-Specific Performance
Tank geometry, cooling performance, racking arm position, internal fittings, or maintenance issues may affect recovery. Tracking results by vessel can reveal whether one tank consistently underperforms comparable equipment.
Building a Practical Fermentation Loss Dashboard
A useful fermentation loss report does not need to be complicated. At a minimum, breweries should track for every brand and style they brew:

Additional fields can be added when they support meaningful analysis:
Dry hop pounds per barrel
Dry hop type (pellet, whole cone, extract, etc.)
Yeast generation
Yeast harvest volume
Tank days
Cold-conditioning days
Transfer operator
Filtration method
Transfer date
Notes or exceptions
The report should make it easy to answer several questions:
Which products experience the greatest fermentation loss?
Which products have the greatest variation?
Are results improving or declining over time?
Are specific tanks associated with lower recovery?
Are certain process changes affecting yield?
How many barrels are being lost above established targets?
What is the estimated financial impact?
The objective is not to create more data for the production team to enter. The objective is to create enough visibility to support better operational decisions.
Focus on Consistency Before Optimization
Before attempting to reduce the average loss percentage, first determine whether the process is stable. A brewery producing the same beer at fermentation losses of 6%, 7%, and 8% has a relatively consistent process.
A brewery producing the same beer at losses of 5%, 14%, and 22% has a variation problem. The average may provide useful information, but the inconsistency is the more urgent operational concern. Large variation suggests that the process may not be standardized or that important production conditions are changing between batches. Reducing variation makes the process more predictable. Once the brewery consistently operates within a reasonable range, the team can begin evaluating additional opportunities to improve average recovery.
This sequence is important: Measure → Standardize → Reduce Variation → Improve Yield
Attempting to optimize an unstable process often produces temporary improvements that are difficult to sustain.
Remember: Small Improvements Produce Meaningful Results Over Time
Fermentation loss rarely attracts attention in the same way as a major equipment failure, quality issue, or missed production schedule. The loss occurs gradually. A barrel is lost during an excessive yeast dump. Another barrel remains behind after an early transfer. Several more barrels are absorbed by dry hops. An inconsistent clarification schedule reduces recovery from one batch. Individually, these losses may appear minor. Across a full production year, they can represent dozens or hundreds of barrels of beer that consumed production resources but never became available for sale.
Improvement begins with visibility. Track fermentation loss by batch. Compare results with reasonable product-specific targets. Measure the volume and financial impact of losses above those targets. Then use the data to identify repeatable process improvements. The goal is not zero loss. The goal is a controlled, consistent, and continuously improving production process that converts more of every barrel brewed into finished beer available for customers. Every additional barrel recovered has already passed through the most resource-intensive stages of production.
Improving fermentation yield allows the brewery to generate more value from the ingredients, labor, equipment, and capacity it already has. That is not simply a production improvement. It is an operational and financial improvement that can directly strengthen brewery profitability.